
This blog post will explain everything about Linux processes, such as how to check and manage them easily. In Linux, a “process” is any active instance of a program. Many threads execute the process, and there are different process models. Some of them are lightweight, but most of them are rooted in an operating system. Linux List Processes allows us to view all running processes better to rationally manage the system resources, such as CPU consumption and RAM.
In the next paragraph, we will show you how to check running processes using real examples using Ubuntu 24.04 OS, but you can choose the Linux distro. Let’s get started!
Table of Contents
Prerequisites
- A server running Linux OS, such as Ubuntu, Debian, AlmaLinux
- User privileges: root or non-root user with sudo privileges
Update the System
Before we type any Linux list process commands, we will update the system packages. To do that, execute the command below:
sudo apt-get update -y && sudo apt-get upgrade -y
Listing Processes with TOP Command
The command top is used for real-time system performance monitoring, such as CPU and memory consumption. It continuously updates the information and informs us about the currently running processes. The most resource-intensive processes are listed at the top. Let’s execute the top command in the terminal:
top
You will get output similar to this:
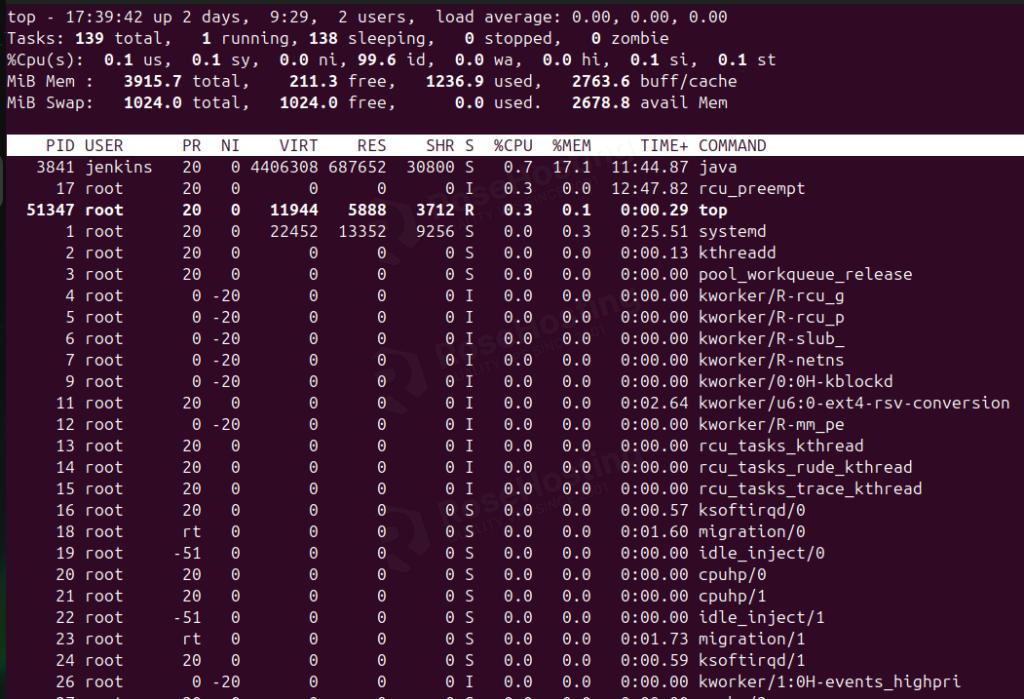
The top command includes shortcuts, and we will explain a few of them below:
m – Sort Processes By Memory Consumption.

n - Sort Processes by PID

c - Absolute Path of the Process

k - Terminate(kill) a Process
If you want to know more about the top command, you can execute the command below:
man top
You will get the following output:
TOP(1)                                                                             User Commands                                                                             TOP(1)

NAME
       top - display Linux processes

SYNOPSIS
       top [options]

DESCRIPTION
       The  top program provides a dynamic real-time view of a running system.  It can display system summary information as well as a list of processes or threads currently being
       managed by the Linux kernel.  The types of system summary information shown and the types, order and size of information displayed for processes are all  user  configurable
       and that configuration can be made persistent across restarts.
                                           .
                                           .
                                           .
                                           .
                                           .
1. COMMAND-LINE Options
       Mandatory arguments to long options are mandatory for short options too.

       Although not required, the equals sign can be used with either option form and whitespace before and/or after the `=' is permitted.

       -b, --batch
          Starts top in Batch mode, which could be useful for sending output from top to other programs or to a file.  In this mode, top will not accept input and runs  until  the
          iterations limit you've set with the `-n' command-line option or until killed.

       -c, --cmdline-toggle
          Starts  top with the last remembered `c' state reversed.  Thus, if top was displaying command lines, now that field will show program names, and vice versa.  See the `c'
          interactive command for additional information.

       -d, --delay = SECS [.TENTHS]
          Specifies the delay between screen updates, and overrides the corresponding value in one's personal configuration file or the startup default.  Later this can be changed
          with the `d' or `s' interactive commands.

          Fractional seconds are honored, but a negative number is not allowed.  In all cases, however, such changes are prohibited if top is running in Secure  mode,  except  for
          root (unless the `s' command-line option was used).  For additional information on Secure mode see topic 6d. SYSTEM Restrictions File.
List Processes with HTOP Command
The htop is an alternative for the top command but is more user-friendly, more interactive, and allows features like scrolling vertically or horizontally to view the complete list of processes. By default, the htop command is not installed on a clean server. To install it on Ubuntu 24.04 you can use the command below:
sudo apt install htop -y
Once it is installed, let’s execute the htop command in the terminal:
htop
You will get output similar to this:
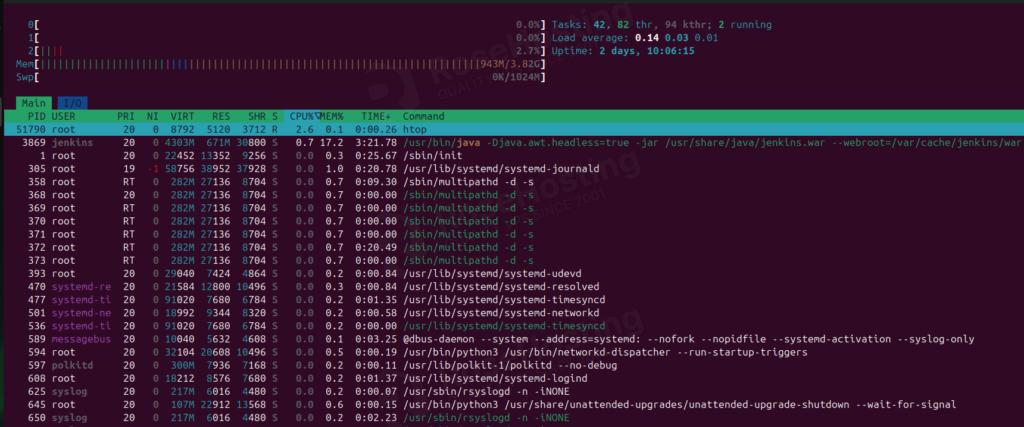
The same as the top command, the htop has various shortcuts, which will be explained below:
F1 - Help Menu

F2 - Setup Menu

F3 - Search Process

F4 - Filter Process By Name

F5 - Display Process in Tree View

F6 - Sort Process by Column

F7 - Decrease the Process Priority

F8 - Incrase the Process Priority

F9 - Kill a Process

F10 - Quit from Htop
More about the htop command can be viewed with the command below:
man htop
You will get the following output:
HTOP(1)                                                                            User Commands                                                                            HTOP(1)

NAME
       htop, pcp-htop - interactive process viewer

SYNOPSIS
       htop [-dCFhpustvH]
       pcp htop [-dCFhpustvH] [--host/-h host]

DESCRIPTION
       htop is a cross-platform ncurses-based process viewer.

       It is similar to top, but allows you to scroll vertically and horizontally, and interact using a pointing device (mouse).  You can observe all processes running on the sys‐
       tem, along with their command line arguments, as well as view them in a tree format, select multiple processes and act on them all at once.

       Tasks related to processes (killing, renicing) can be done without entering their PIDs.

       pcp-htop  is  a version of htop built using the Performance Co-Pilot (PCP) Metrics API (see PCPIntro(1), PMAPI(3)), allowing to extend htop to display values from arbitrary
       metrics.  See the section below titled CONFIG FILES for further details.
List Processes with ATOP
The atop command is a process monitor tool that offers additional data through its login capabilities. It logs and monitors system processes for up to 28 days. This allows us to analyze terminated processes and in-depth system performance analyses. To get output from the atop, we will execute it in the terminal:
atop
The output will be the following:
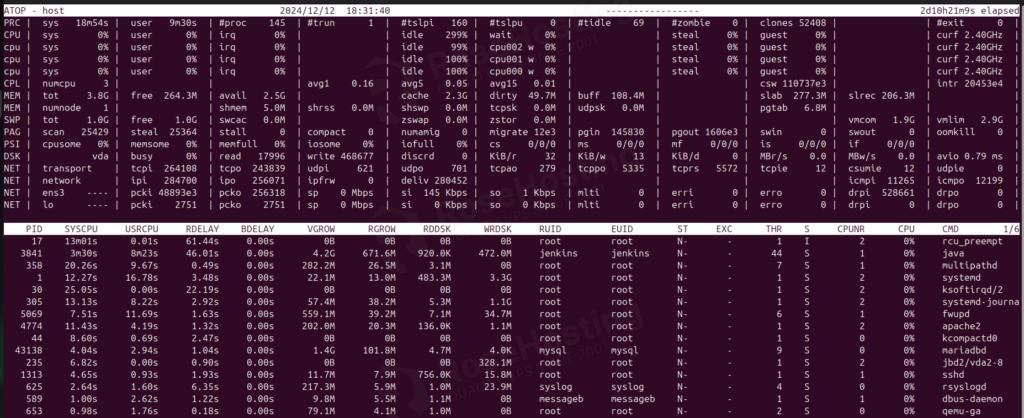
The same as the top and htop commands, the atop has various shortcuts, which will be explained below:
 c - CPU Usage

 d - Disk Usage

 m - Memory Usage

 n - Network Activity

 a - The Most Active Resources
Also, some arguments can be added to the atop command for various outputs:
-m - Information about Memory Consumption

-c - Command line for each process

-d - Information about the Disk

-a - Active processes during intervals
More about the atop command can be viewed with the command below:
man atop
You will get the following output:
ATOP(1)                                                                       General Commands Manual                                                                       ATOP(1)

NAME
       atop - Advanced System & Process Monitor

SYNOPSIS
       Live measurement in bar graph mode:

         atop -B[H] [interval [samples]]

       Live measurement in text mode:

         atop [-g|-m|-d|-n|-u|-p|-s|-c|-v|-o|-y|-Y] [-C|-M|-D|-N|-A] [-fFG1xR] [interval [samples]]

       Live generation of parsable output (white-space separated or JSON):

         atop [-Plabel[,label]... [-Z]] [-Jlabel[,label]...] [interval [samples]]

       Write raw log files:

         atop -w rawfile [-a] [-S] [interval [samples]]
                             .
                             .
                             .
The PS command
The ps command is one of the most used commands for listing the processes. It is usually executed by the arguments aux:
ps aux
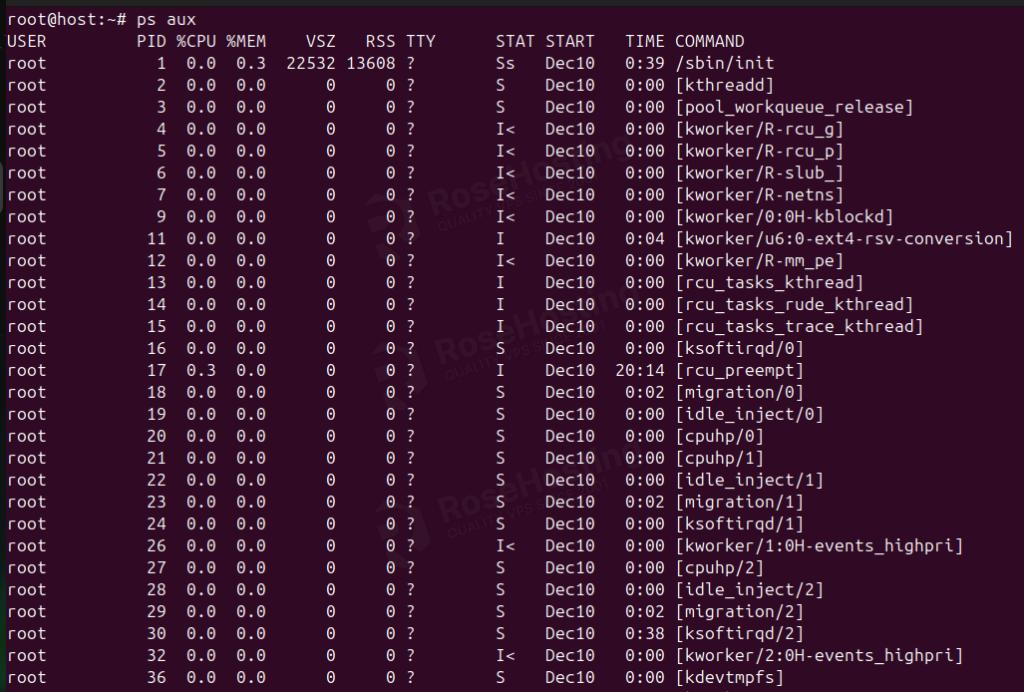
The command is very straightforward with its arguments, and more about it can be viewed with:
man ps
You will get the following output:
PS(1)                                                                              User Commands                                                                              PS(1)

NAME
       ps - report a snapshot of the current processes.

SYNOPSIS
       ps [options]

DESCRIPTION
       ps displays information about a selection of the active processes.  If you want a repetitive update of the selection and the displayed information, use top instead.

       This version of ps accepts several kinds of options:

       1   UNIX options, which may be grouped and must be preceded by a dash.
       2   BSD options, which may be grouped and must not be used with a dash.
       3   GNU long options, which are preceded by two dashes.

       Options  of  different  types may be freely mixed, but conflicts can appear.  There are some synonymous options, which are functionally identical, due to the many standards
       and ps implementations that this ps is compatible with.
The PSTREE Command
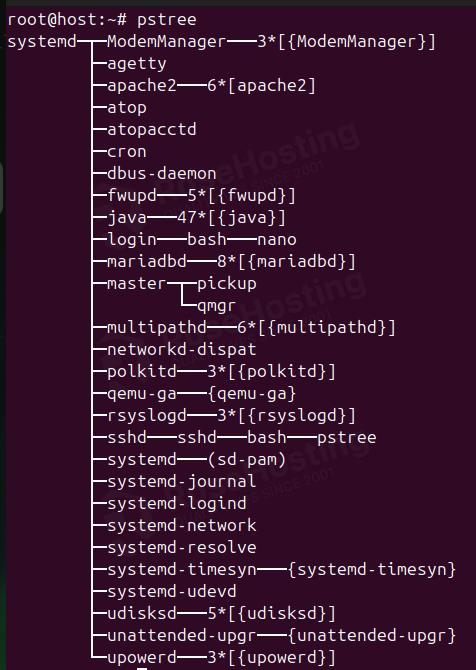
The pstree command is a visual representation of the process hierarchy in Linux. The pstree command organizes the processes in a tree structure and displays the relationships between them.
pstree
The output of the pstree commands is the following one:
More about the pstree command can be viewed with:
man pstree
You will get the following output:
PSTREE(1)                                                                          User Commands                                                                          PSTREE(1)

NAME
       pstree - display a tree of processes

SYNOPSIS
       pstree [-a, --arguments] [-c, --compact-not] [-C, --color attr] [-g, --show-pgids] [-h, --highlight-all, -H pid, --highlight-pid pid] [-l, --long] [-n, --numeric-sort]
       [-N, --ns-sort ns] [-p, --show-pids] [-s, --show-parents] [-S, --ns-changes] [-t, --thread-names] [-T, --hide-threads] [-u, --uid-changes] [-Z, --security-context]
       [-A, --ascii, -G, --vt100, -U, --unicode] [pid, user]
       pstree -V, --version

DESCRIPTION
       pstree  shows  running processes as a tree.  The tree is rooted at either pid or init if pid is omitted.  If a user name is specified, all process trees rooted at processes
       owned by that user are shown.

       pstree visually merges identical branches by putting them in square brackets and prefixing them with the repetition count, e.g.
That’s it. You learned various methods about the Linux list processes commands, like ps, pstree, atop, htop, and top.
If you have difficulties with these commands, our Linux admins will help you with any aspect. All you have to do is sign up for one of our Linux VPS hosting plans. Do not hesitate to contact us anytime. We are available 24/7.
If you liked this post about Linux List Processes, please share it with your friends on social networks using the buttons on the left or leave a reply below. Thanks.