
This tutorial will explain how to use the htop command in Linux with examples. The htop command in the Linux system is a command line utility that actively allows users to monitor the system processes and resource usage in real-time. It is based on the top command with improvements and a better overview. Using the htop command gives colored visualization of CPU, RAM, and SWAP usage. It also allows users to scroll vertically and horizontally to check the full lines of processes and their data.
In the following paragraphs, we will show practical examples with the htop command on Ubuntu 24.04. Let’s get started!
Table of Contents
Prerequisites
- An Ubuntu server running version 24.04 or any Linux OS (CentOS, Debian, or AlmaLinux)
- User privileges: root or non-root user with sudo privileges
System Update
Before we start executing the htop command, we will update the system packages to their latest versions available. To do that, execute the following command:
sudo apt update -y && sudo apt upgrade -y
Syntax of htop
The syntax of htop is very simple. You need to type the htop along with some of the arguments or leave it without any of them.
htop "argument"
1. Htop without arguments
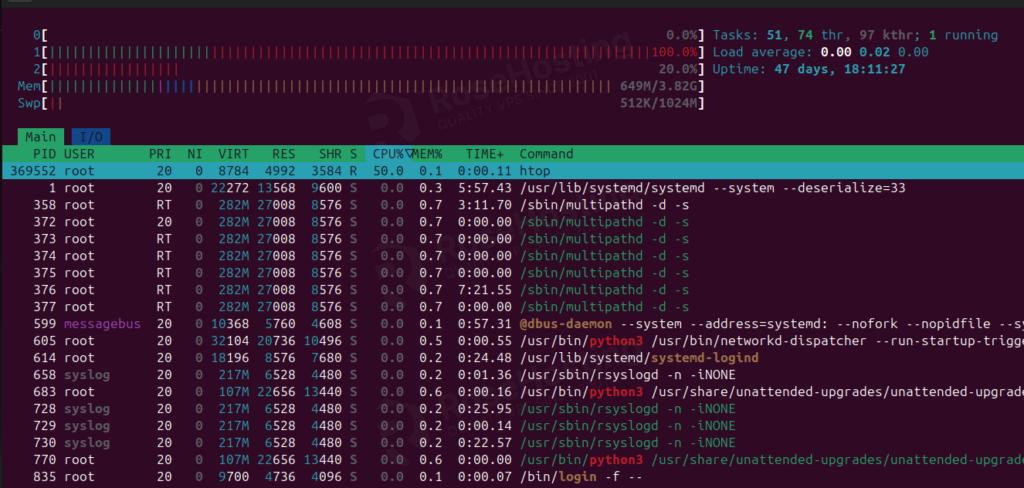
The most common htop command is the htop command without any arguments. You can execute the following command in your terminal:
htop
You will get an output as in the picture below:
2. Show processes from a specific user
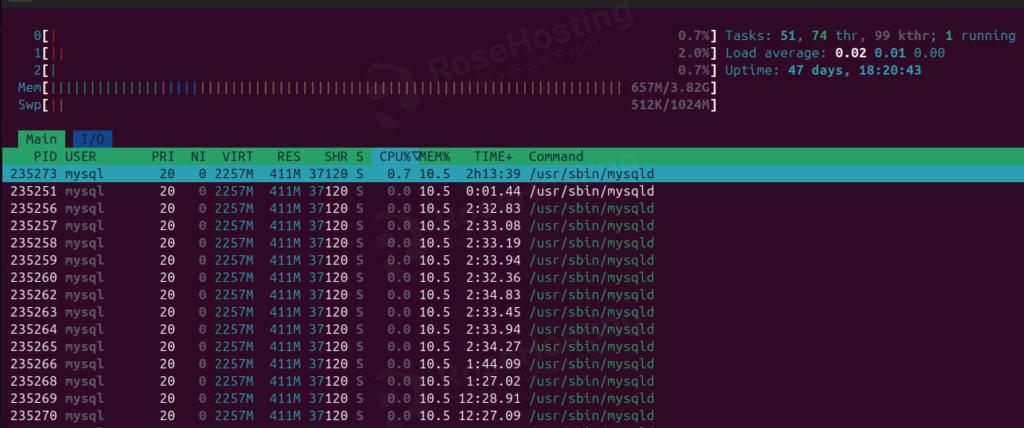
To show the processes from a specific user, in this case, the mysql user you need to execute the following command:
htop -u mysql
You should get the following output
3. Sorting by column
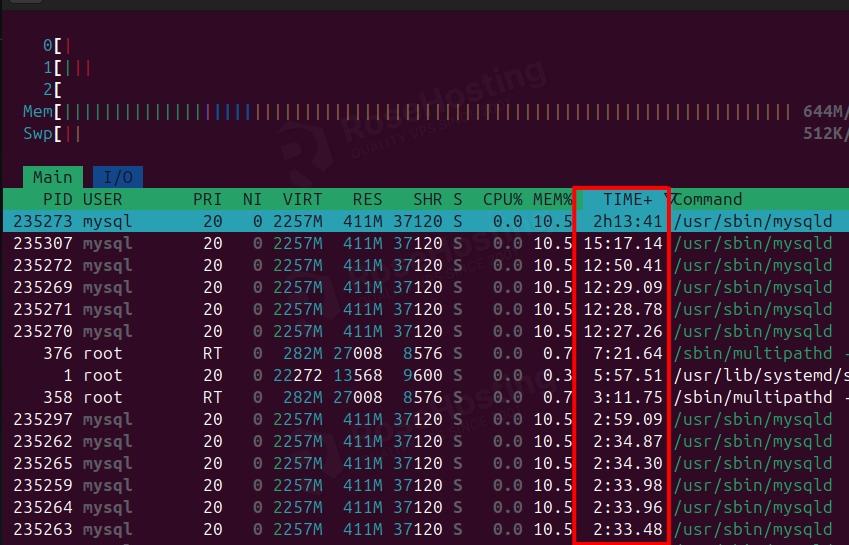
To sort the output of the htop command by the specific command (by the TIME in our example) you need to execute the following command:
htop -s TIME
As you can see in the screenshot below, the column TIME is selected, and the time is in descending order.
4. Show specific processes by their IDs
The htop command allows us to show only the processes with the given IDs as its arguments:
htop -p 235296
There will be info only about this process, which can be killed with the F9 command:

5. Show the tree with Htop
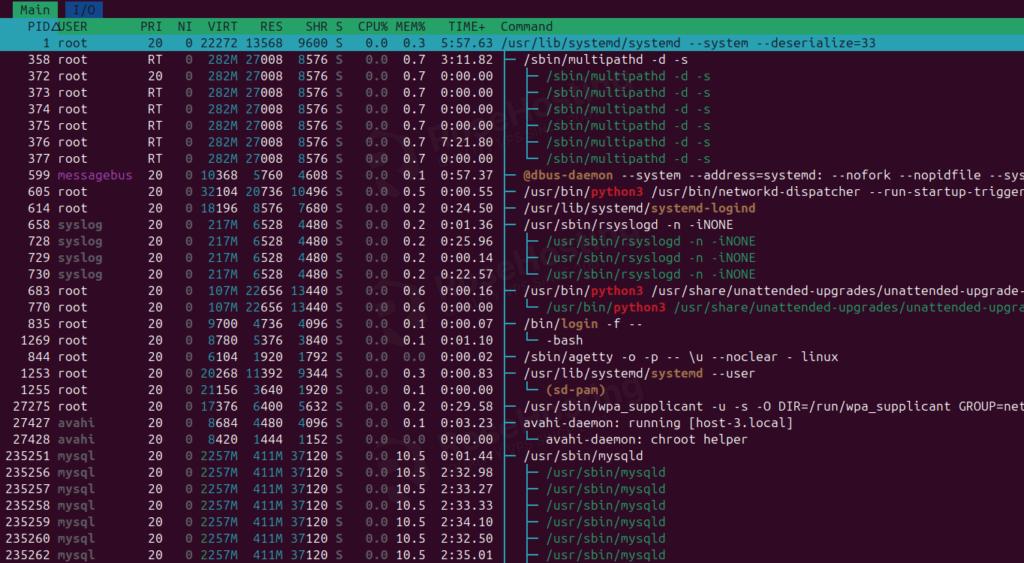
This command will display the process hierarchy in tree view in the commands column:
htop -t
You will get the following output:
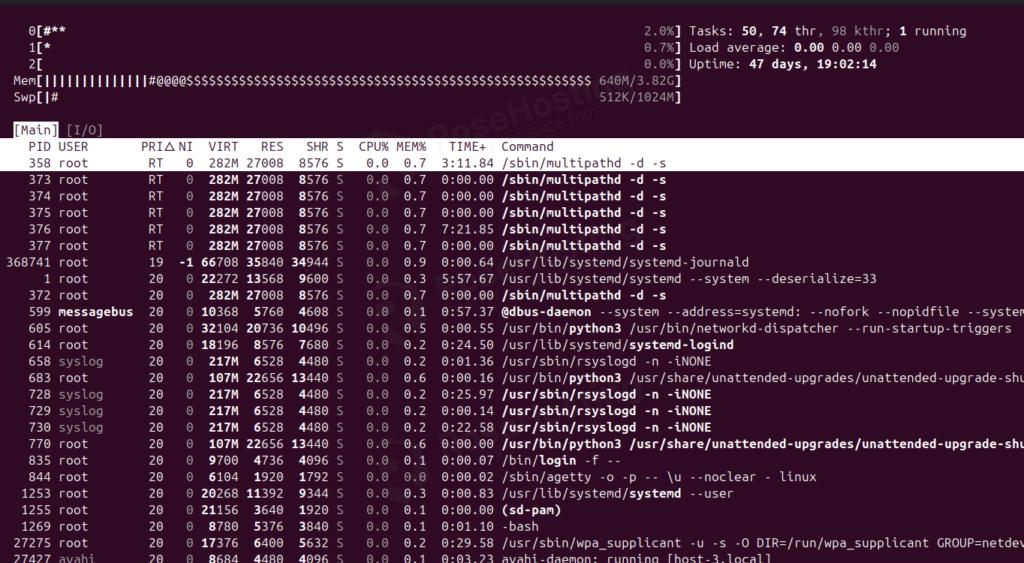
6. Turn off the colors in htop output
If we do not want to have colored output, we can execute htop with the -C:
htop -C
The output should be as in the screenshot below:
7. Htop in more detail
If you want to know everything about the htop, you can execute the following command in your terminal:
HTOP(1)                                                                            User Commands                                                                            HTOP(1)

NAME
       htop, pcp-htop - interactive process viewer

SYNOPSIS
       htop [-dCFhpustvH]
       pcp htop [-dCFhpustvH] [--host/-h host]

DESCRIPTION
       htop is a cross-platform ncurses-based process viewer.

       It is similar to top, but allows you to scroll vertically and horizontally, and interact using a pointing device (mouse).  You can observe all processes running on the sys‐
       tem, along with their command line arguments, as well as view them in a tree format, select multiple processes and act on them all at once.

       Tasks related to processes (killing, renicing) can be done without entering their PIDs.

       pcp-htop  is  a version of htop built using the Performance Co-Pilot (PCP) Metrics API (see PCPIntro(1), PMAPI(3)), allowing to extend htop to display values from arbitrary
       metrics.  See the section below titled CONFIG FILES for further details.

COMMAND-LINE OPTIONS
       Mandatory arguments to long options are mandatory for short options too.

       -d --delay=DELAY
              Delay between updates, in tenths of a second. If the delay value is less than 1, it is increased to 1, i.e. 1/10 second. If the delay value is greater than  100,  it
              is decreased to 100, i.e. 10 seconds.

       -C --no-color --no-colour
              Start htop in monochrome mode

       -F --filter=FILTER
              Filter processes by terms matching the commands. The terms are matched case-insensitive and as fixed strings (not regexs). You can separate multiple terms with "|".

       -h --help
              Display a help message and exit

       -p --pid=PID,PID...
              Show only the given PIDs

       -s --sort-key COLUMN
              Sort by this column (use --sort-key help for a column list).  This will force a list view unless you specify -t at the same time.
That was it. You learned some basic and essential htop commands on Linux OS. You learned how to monitor system processes and resource usage easily. Of course, if you have an issue with the command, you can always contact our technical support, and our admins will help you with it immediately. We will provide you with a complete list of your server resource usage. Just sign up for one of our Linux NVMe VPS hosting plans and submit a support ticket. We are available 24/7